Pictogram and mode
Week 9&10
TOPIC: Pictogram and mode
SUBTOPIC: Bar graph and mode
OBJECTIVES: At the end of the lesson, pupils should be able to:
1. Represent data on a pictogram.
2. Determine the mode from the pictogram
3. Read and interpret the bar graph
4. Determine the mode from the bar graph
5. Appreciate the presence of the most common events/data in daily activities.
CONTENT
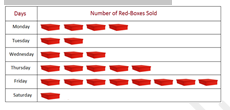
1. Number of red-coloured boxes sold by William, a shopkeeper, in six days a week. See the picture graph or pictograph to answer the questions.
Examples of Pictographs
Information gathered from the above table:(i) Number of red boxes sold:
Monday – 4, Tuesday – 2, Wednesday – 3, Thursday – 5, Friday – 8, Saturday – 1
Subscribe now to gain full access to this lesson note
Take Me ThereClick here to gain access to the full notes.


